Urinary stone removal waiting times in Australian public hospitals
The national median wait for urinary stone removal in Australian public hospitals was 25 days in 2024–25 (AIHW MyHospitals, released 28 May 2026). Hospital medians ranged from 13 days at Frankston Public Surgical Centre to 80 days at Campbelltown Hospital. The source publishes this surgery as "Stone/s urinary tract - removal of".
Reference period 2024–25 (1 July 2024 to 30 June 2025) · released 28 May 2026.
Across Australia, the median wait for urinary stone removal in public hospitals was 25 days in 2024–25, from 3653 surgeries. 1.5% of people waited more than 365 days. 28 public hospitals published a median wait for it.
Compare this near you → On the compare page, pick "Stone/s urinary tract - removal of" and type your suburb to see the public hospitals within reach, ordered by their published wait. Nothing you type there is kept.
State by state
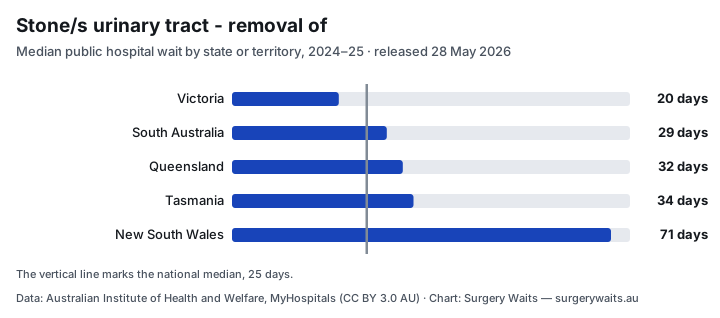
Bars show the median wait in days. The vertical line at 25 days marks the national median.
Victoria: 20 days
South Australia: 29 days
Queensland: 32 days
Tasmania: 34 days
New South Wales: 71 days
Northern Territory: not published
Western Australia: not published
| Rank | State or territory | Median wait | Waited more than 365 days | Surgeries |
|---|---|---|---|---|
| 1 | Victoria | 20 days | 0.8% | 1680 surgeries |
| 2 | South Australia | 29 days | 0.7% | 446 surgeries |
| 3 | Queensland | 32 days | 0.3% | 301 surgeries |
| 4 | Tasmania | 34 days | 0.8% | 251 surgeries |
| 5 | New South Wales | 71 days | 4.1% | 878 surgeries |
| unranked | Northern Territory | not published | not published | 82 surgeries |
| unranked | Western Australia | not published | not published | 15 surgeries |
Ranked by area: near the Adelaide CBD · near Clayton · near Elizabeth Vale · near Frankston · near Liverpool · near St Albans · and 1 more area on the state pages.
How the wait has changed
- Australia
- VIC
- SA
- QLD
View these numbers as a table
| Reference period | Australia (days) | VIC (days) | SA (days) | QLD (days) |
|---|---|---|---|---|
| 2016–17 | 28 | 22 | not published | 24 |
| 2017–18 | 29 | 22 | not published | not published |
| 2018–19 | 26 | 19 | not published | 22 |
| 2019–20 | 28 | 23 | not published | 24 |
| 2020–21 | 29 | 20 | not published | 26 |
| 2021–22 | 21 | 16 | not published | 21 |
| 2022–23 | 23 | 18 | 51 | 28 |
| 2023–24 | 24 | 14 | 39 | 34 |
| 2024–25 | 25 | 20 | 29 | 32 |
Common questions
How long is the wait for urinary stone removal in a public hospital?
The national median was 25 days in 2024–25 (AIHW MyHospitals, released 28 May 2026). Half of people waited less than that, half waited longer. State medians ranged from 20 days in Victoria to 71 days in New South Wales.
Which public hospital has the shortest wait for urinary stone removal?
Of the 28 public hospitals that published a median for 2024–25, Frankston Public Surgical Centre reported the shortest median, 13 days, and Campbelltown Hospital the longest, 80 days (AIHW MyHospitals, released 28 May 2026). A shorter median is not a recommendation. How to read these figures.
How many people waited more than a year?
1.5% of people who had urinary stone removal in an Australian public hospital in 2024–25 waited more than 365 days (AIHW MyHospitals, released 28 May 2026).
Cite this page
The national median wait for urinary stone removal in Australian public hospitals was 25 days in 2024–25 (AIHW MyHospitals, released 28 May 2026).
Copy-ready citation
Surgery Waits, "Urinary stone removal waiting list by state, 2024–25", 2024–25 data released 28 May 2026, https://surgerywaits.au/surgery/stone-s-urinary-tract-removal-of/, accessed 28 May 2026.Attribution: Surgery Waits (https://surgerywaits.au/surgery/stone-s-urinary-tract-removal-of/), from Australian Institute of Health and Welfare MyHospitals data, CC BY 3.0 AU. Reference period 2024–25, released 28 May 2026.
Embed the chart
The state comparison is also published as a standalone image at a stable address — the SVG chart — free to embed or link with the attribution below:
<img src="https://surgerywaits.au/charts/stone-s-urinary-tract-removal-of.svg" width="720" height="318" alt="Median public hospital waiting time for Urinary stone removal by state and territory, 2024–25">What is not here
Public hospitals only. Private hospitals do not report to this collection, so their waiting times cannot be compared here.
The source calls this collection "elective surgery". This site calls it planned surgery, because the surgery is planned in advance rather than optional — the methodology explains the wording.